Quantisnow data
Quantisnow Analyst Sentiment Index
Monthly count of Wall Street analyst upgrades, downgrades and new coverage on US-listed stocks, with the upgrade-to-downgrade ratio overall and by sector.
Last updated . Recomputed daily.
In October 2026, analysts issued 263 upgrades and 295 downgrades on stocks tracked by Quantisnow, an upgrade-to-downgrade ratio of 0.89 (September: 1.00).
October 2026 at a glance
- Upgrades
- 263
- Prior month: 206
- Downgrades
- 295
- Prior month: 205
- Upgrade-to-downgrade ratio
- 0.89
- Prior month: 1.00
- Coverage initiated
- 559
- Prior month: 601
- Ratings reiterated
- 101
- Prior month: 266
- All rating actions
- 1,218
- Prior month: 1,278
Upgrades and downgrades by sector, October 2026
| Sector | Upgrades | Downgrades | Ratio | All actions |
|---|---|---|---|---|
| Health Care | 29 | 54 | 0.54 | 259 |
| Finance | 42 | 56 | 0.75 | 197 |
| Consumer Discretionary | 57 | 42 | 1.36 | 180 |
| Industrials | 40 | 37 | 1.08 | 162 |
| Technology | 38 | 57 | 0.67 | 162 |
| Real Estate | 19 | 15 | 1.27 | 62 |
| Utilities | 7 | 6 | 1.17 | 60 |
| Energy | 7 | 10 | 0.70 | 59 |
| Basic Materials | 8 | 5 | 1.60 | 24 |
| Consumer Staples | 4 | 10 | 0.40 | 18 |
| Unclassified | 2 | 0 | 0.00 | 11 |
| Telecommunications | 5 | 3 | 1.67 | 9 |
| Miscellaneous | 1 | 0 | 0.00 | 8 |
| n/a | 3 | 0 | 0.00 | 5 |
| Transportation | 1 | 0 | 0.00 | 2 |
Monthly history
Each month links to its own archive page with the full breakdown.
| Month | Upgrades | Downgrades | Upgrade-to-downgrade ratio | Coverage initiated | Ratings reiterated |
|---|---|---|---|---|---|
| October 2026 | 263 | 295 | 0.89 | 559 | 101 |
| September 2026 | 206 | 205 | 1.00 | 601 | 266 |
| August 2026 | 253 | 331 | 0.76 | 240 | 179 |
| July 2026 | 259 | 345 | 0.75 | 443 | 273 |
| June 2026 | 214 | 205 | 1.04 | 378 | 168 |
| May 2026 | 273 | 285 | 0.96 | 349 | 236 |
| April 2026 | 321 | 317 | 1.01 | 498 | 271 |
| March 2026 | 348 | 244 | 1.43 | 494 | 206 |
| February 2026 | 290 | 356 | 0.81 | 279 | 190 |
| January 2026 | 469 | 463 | 1.01 | 434 | 302 |
| December 2025 | 311 | 282 | 1.10 | 532 | 181 |
| November 2025 | 316 | 245 | 1.29 | 389 | 163 |
| October 2025 | 373 | 339 | 1.10 | 803 | 310 |
| September 2025 | 249 | 242 | 1.03 | 474 | 190 |
| August 2025 | 279 | 278 | 1.00 | 306 | 225 |
| July 2025 | 301 | 400 | 0.75 | 480 | 309 |
| June 2025 | 182 | 186 | 0.98 | 423 | 172 |
| May 2025 | 248 | 329 | 0.75 | 240 | 243 |
| April 2025 | 377 | 400 | 0.94 | 365 | 216 |
| March 2025 | 337 | 243 | 1.39 | 383 | 169 |
| February 2025 | 292 | 352 | 0.83 | 260 | 66 |
| January 2025 | 543 | 415 | 1.31 | 348 | 125 |
| December 2024 | 380 | 371 | 1.02 | 478 | 233 |
| November 2024 | 266 | 399 | 0.67 | 344 | 236 |
| October 2024 | 284 | 411 | 0.69 | 491 | 245 |
| September 2024 | 222 | 249 | 0.89 | 469 | 168 |
| August 2024 | 318 | 394 | 0.81 | 261 | 197 |
| July 2024 | 217 | 363 | 0.60 | 350 | 281 |
| June 2024 | 176 | 144 | 1.22 | 390 | 132 |
| May 2024 | 293 | 285 | 1.03 | 284 | 216 |
| April 2024 | 297 | 276 | 1.08 | 384 | 229 |
| March 2024 | 254 | 243 | 1.05 | 417 | 159 |
| February 2024 | 248 | 359 | 0.69 | 310 | 274 |
| January 2024 | 427 | 652 | 0.65 | 439 | 187 |
| December 2023 | 279 | 332 | 0.84 | 481 | 159 |
| November 2023 | 248 | 364 | 0.68 | 369 | 104 |
| October 2023 | 370 | 327 | 1.13 | 584 | 120 |
| September 2023 | 228 | 186 | 1.23 | 507 | 89 |
| August 2023 | 285 | 378 | 0.75 | 218 | 195 |
| July 2023 | 241 | 381 | 0.63 | 344 | 266 |
| June 2023 | 203 | 240 | 0.85 | 434 | 90 |
| May 2023 | 319 | 246 | 1.30 | 250 | 211 |
| April 2023 | 266 | 240 | 1.11 | 389 | 388 |
| March 2023 | 338 | 273 | 1.24 | 335 | 83 |
| February 2023 | 207 | 403 | 0.51 | 226 | 173 |
| January 2023 | 370 | 692 | 0.53 | 330 | 129 |
| December 2022 | 189 | 401 | 0.47 | 464 | 156 |
| November 2022 | 226 | 511 | 0.44 | 267 | 66 |
| October 2022 | 230 | 422 | 0.55 | 481 | 287 |
| September 2022 | 190 | 251 | 0.76 | 508 | 145 |
| August 2022 | 166 | 473 | 0.35 | 285 | 117 |
| July 2022 | 210 | 487 | 0.43 | 360 | 201 |
| June 2022 | 221 | 326 | 0.68 | 371 | 136 |
| May 2022 | 280 | 332 | 0.84 | 223 | 128 |
| April 2022 | 233 | 421 | 0.55 | 463 | 179 |
| March 2022 | 338 | 452 | 0.75 | 386 | 1,408 |
| February 2022 | 325 | 358 | 0.91 | 344 | 2,690 |
| January 2022 | 649 | 627 | 1.04 | 517 | 1,886 |
| December 2021 | 346 | 350 | 0.99 | 669 | 1,440 |
| November 2021 | 341 | 469 | 0.73 | 778 | 2,446 |
| October 2021 | 315 | 425 | 0.74 | 824 | 2,093 |
| September 2021 | 274 | 265 | 1.03 | 575 | 1,074 |
| August 2021 | 328 | 414 | 0.79 | 666 | 2,249 |
| July 2021 | 346 | 320 | 1.08 | 704 | 1,898 |
Methodology
Every analyst rating action Quantisnow receives is stored with its brokerage, prior and new rating, and price target. Each action is classified as an upgrade, downgrade, initiation of coverage, resumption of coverage or reiteration (which includes price-target-only changes).
The upgrade-to-downgrade ratio is upgrades divided by downgrades for the month. Sector comes from the covered company's profile; companies without a sector are grouped as Unclassified.
Figures are recomputed daily from the Quantisnow event database. The current month is marked as month to date until it closes; the previous month is recomputed daily through the following month to pick up late filings, then stays fixed.
Definitions for every column are in the JSON download.
Metric definitions
- Upgrades
- (
upgrades) - Downgrades
- (
downgrades) - Upgrade-to-downgrade ratio
- (
ratio): Upgrades divided by downgrades. Above 1.00 means more upgrades than downgrades. - Coverage initiated
- (
initiations) - Ratings reiterated
- (
reiterations) - All rating actions
- (
total)
Download and cite
Free to reuse under CC BY 4.0 with attribution to Quantisnow and a link to this page.
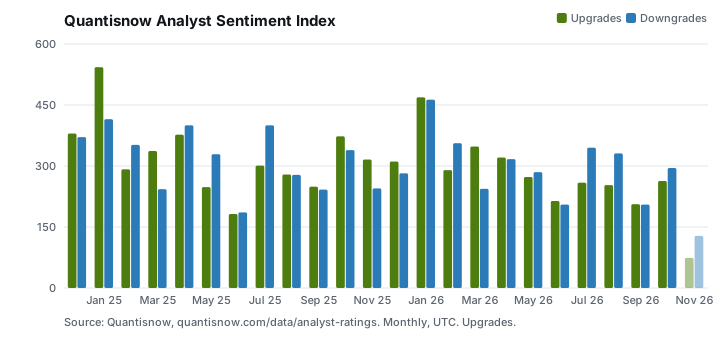
Quantisnow. (2026). Quantisnow Analyst Sentiment Index [Data set]. Retrieved November 1, 2026, from https://www.quantisnow.com/data/analyst-ratings
<figure style="margin:0;max-width:720px"><a href="https://www.quantisnow.com/data/analyst-ratings"><img src="https://www.quantisnow.com/data/analyst-ratings.svg" alt="Quantisnow Analyst Sentiment Index chart" width="720" height="340" style="width:100%;height:auto" loading="lazy"></a><figcaption style="font:12px sans-serif;color:#5b6470">Source: <a href="https://www.quantisnow.com/data/analyst-ratings">Quantisnow Analyst Sentiment Index</a> by Quantisnow</figcaption></figure>