Short volume ratio in June 2026
Last updated . Recomputed daily.
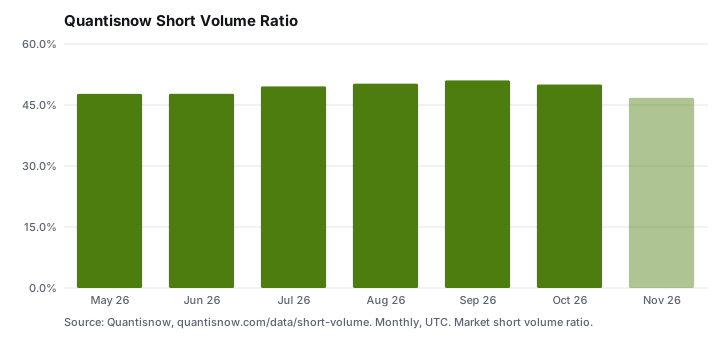
In June 2026, short sales made up 47.7% of FINRA-reported volume across US stocks (May: 47.7%), and 2,219 liquid stocks had a monthly short volume ratio above 50%.
Key figures
- Market short volume ratio
- 47.7%
- Prior month: 47.7%
- Highest daily ratio
- 50.5%
- Prior month: 49.8%
- Lowest daily ratio
- 46.4%
- Prior month: 45.4%
- Liquid stocks above 50%
- 2,219
- Prior month: 2,187
- Liquid stocks measured
- 4,585
- Prior month: 4,495
- Trading days
- 21
- Prior month: 20
Highest short volume ratios (5M+ shares of monthly volume), June 2026
Methodology
FINRA publishes daily short sale volume for every security reported to its consolidated trade reporting facilities. Quantisnow ingests the file every trading day. The short volume ratio is short sale volume divided by total reported volume.
FINRA short sale volume is not short interest: market makers report many short sales while providing liquidity, so ratios around 40 to 50% are normal. The series is useful for relative comparisons across time and between stocks, not as a measure of bearish positioning on its own.
Monthly stock ratios are volume-weighted (sum of short volume over sum of total volume for the month). The ranking excludes stocks with under 5 million shares of reported monthly volume to avoid thinly traded names.
Figures are recomputed daily from the Quantisnow event database. The current month is marked as month to date until it closes; the previous month is recomputed daily through the following month to pick up late filings, then stays fixed.
Definitions for every column are in the JSON download.
Metric definitions
- Market short volume ratio
- (
ratio): Sum of FINRA short sale volume divided by sum of total reported volume, all covered stocks. - Highest daily ratio
- (
highDay) - Lowest daily ratio
- (
lowDay) - Liquid stocks above 50%
- (
above50): Stocks with 1M+ shares of monthly reported volume whose monthly short ratio exceeded 50%. - Liquid stocks measured
- (
liquid) - Trading days
- (
days)
Download and cite
Free to reuse under CC BY 4.0 with attribution to Quantisnow and a link to this page.
Quantisnow. (2026). Quantisnow Short Volume Ratio, June 2026 [Data set]. Retrieved October 27, 2026, from https://www.quantisnow.com/data/short-volume/2026-06
<figure style="margin:0;max-width:720px"><a href="https://www.quantisnow.com/data/short-volume"><img src="https://www.quantisnow.com/data/short-volume.svg" alt="Quantisnow Short Volume Ratio chart" width="720" height="340" style="width:100%;height:auto" loading="lazy"></a><figcaption style="font:12px sans-serif;color:#5b6470">Source: <a href="https://www.quantisnow.com/data/short-volume">Quantisnow Short Volume Ratio</a> by Quantisnow</figcaption></figure>